Historical Flow and Payload Data
The Historical Flow and Payload Data queries require that Network Analysis and File Carving plugin be enabled because the queries are served by the NTOP Web server on the sensor.
Contents
Browser Initialization
There are few pieces of information your browser needs to cache in order to perform the query. The first time you execute a query, you will be prompted to login again into the system to authenticate yourself with the sensor where the payload resides. After that, the browser will remember the login information.
Sensor as a Server
For sensors configured as a server, after your login, the system will generate a warning on the top-right that the browser that is not able to perform a cross connection to the sensor. Please click on the link contained in that warning dialog to install a self-signed certificate in the browser. Note that Firefox will remember the certificate across browser restarts while Chrome does not (and therefore this action needs to be performed every time Chrome is restarted). A page indicating that the browser is now ready will appear and you can now repeat the query. From now on, the query should take you directly to the Pcap information without any more prompts. Sometimes, when the sensor is very busy and the query takes longer than expected, this warning will appear even thought the browser correctly initialized. In these cases, it is safe to ignore the warning by closing it. NOTE that starting from version 44.0.x Chrome does not accept self-signed certificates anymore. We recommend therefore to use Firefox or older versions of Chrome.
Preforming Queries
The Historical Flow and Payload Data page can be reached by:
- Right-clicking on any record in the Real-Time or Historical page and then clicking on Show Files in Flow(s) to query for all TCP and UDP streams associated with that event records +- 1 hour from the event time.
- The Search Events or Flows form.
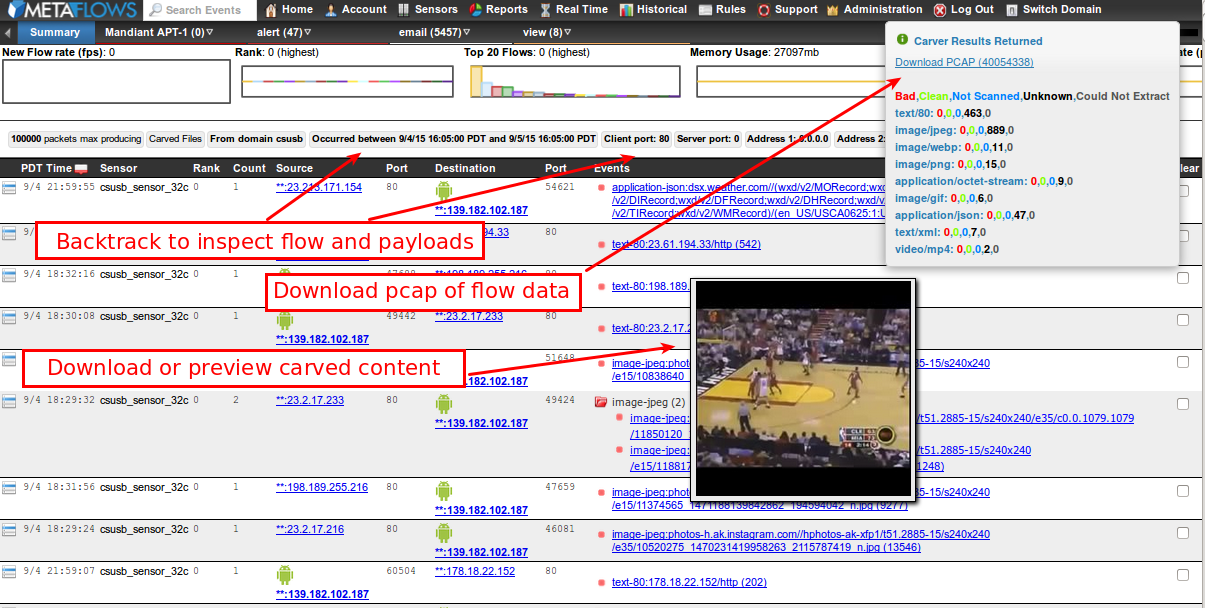
Such actions will open an Historical Flow and Payload Data page as shown below:
This operation returns the flows and files that were carved/reconstructed from the historical packet logs. All of the packets found can then be downloaded by clicking on the Pcap link. Note that if you have ‘Log All Packets‘ enabled, you will most likely see the PCAP slice as well as all the files that where downloaded/uploaded in that flow or set of flows. If you do not have ‘Log All Packets‘ enabled, you will only see the PCAP slice corresponding to the packets logged by the IDS or session logging system.
Some of the extracted content can be previewed by hovering the mouse over the URLs. All of the extracted content can be downloaded and opened in a separate browser window, or stored by the user for inspection using other tools. The Historical Flow data page has similar query capabilities of the Historical View page and therefore the user can interactively mine the flow history by changing query parameters and/or time windows for the queries using the menu shown below or the Search Events or Flows form.
In both cases, historical flow and payload data queries must contain 32-bit IPv4 addresses and cannot be performed using wildcards in the addresses. Also, the keyword search capability is not available for these types of queries.
Get Packet Payloads with Splunk
It is fairly easy to create a workflow action to access the MetaFlows File-Carving and PCAP extraction interface.
Step 1: Extract the flow information from the MetaFlows event feed.
If you already use CEF log output from MetaFlows, or if you want to change to it, then the required fields should already be extracted: src, dst, spt, dpt, start
Or, if you are using the standard syslog output then you will need something similar to the following extraction regex to make sure each record has those fields: \{1,(?<rank>\d+)\}\s+\[\d+:(?<sid>\d+):\d+\]\s+(?<msg>[^\{]*)\{IP\}\s+(?<src>[^:]*):(?<spt>\d+)\s-\>\s(?<dst>[^:]*):(?<dpt>\d+)
Additionally, you will need to append “|eval start=_time” to your queries in order to get the start field unless you already have a derived field which gives you a Unix timestamp to use in the query. However, if you have your own parsing in place that uses different field names which correspond to ‘Source IP, Destination IP, Source Port, Destination Port, Timestamp‘ then you may need to adjust the field names in the URI under step 2 to match. You will still need to make sure that you can provide a Unix timestamp field.
Step 2: Create a workflow action.
Go to Settings->Fields->Workflow Actions->New and set the following fields:
- Label: Extract PCAP / Carve Files $src$ $dst$ $start$
- Show action in: Both
- Action Type: Link
- URI: https://nsm.metaflows.com/sockets/historical.php?w=carver&srca=$src$&dsta=$dst$&srcp=$spt$&dstp=$dpt$&st=$start$&sensor_sid=your_sensor_SID
- Open link in: New Window
- Link method: Get
Your sensor’s SID should be a hash listed on the View Sensors page, or in the file /nsm/etc/UUID on the sensor itself. If you have a GES system, substitute nsm.metaflows.com with the domain name of your controller.
Step 3: Test the Setup.
Test the setup by selecting Extract PCAP/Carve Files from the Event Actions menu for any event in a search. You need to be logged into MetaFlows for this to work. After properly initializing the browser for the first time, it should take you straight to the File Carving interface which will provide a link to the PCAP data as well.
| Previous Chapter | Next Chapter |
 1 (877) 664-7774 - support@metaflows.com
