Event Graphs
From The MetaFlows Security System Documentation
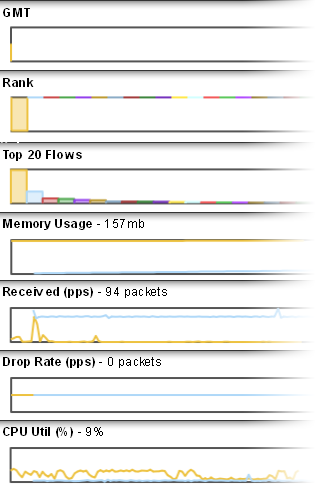
Both the Historical and Real-Time Event Screens show Event Graphs for the purpose of monitoring the system performance. Each graph can be selected to enlarge it for further details and the event graphs in Figure 1 display the following:
- New Flows Rate – This is the rate at which new events are received for each of the defined classifications.
- Rank – The is value of the top twenty events sorted by rank. (In this case, rank is a measure of how important an event is with respect to the global correlation.)
- Flows – This is the top twenty events by count. This graph uses slightly different data in the Historical Reports and Real-Time interfaces:
- Historical Reports – This is the number of occurrences.
- Real Time – This is the number of flows.
- Memory Usage – This shows a time graph of the memory usage for every sensor.
- Received (pps) – This is a time graph of the amount of packets received by each sensor.
- Drop Rate (pps) – This is a time graph of the packet drop rate for each sensor.
- CPU Util – This is the CPU utilization for each sensor.
| Previous Chapter | Next Chapter |
 1 (877) 664-7774 - support@metaflows.com
