Historical View
The Historical View shows the IDS events, incident reports, syslog messages, file transmissions and service/host discovery events accumulated by the sensor over a period of time. The Historical Views are generated by querying the MetaFlows site and correlating events with global relevance data. The view defaults to the past twenty-four hours when it is first invoked and attempts to optimize the reporting in a way to condense information in as few rows as possible by grouping similar events. The aggregation is performed by coalescing the highest similarity on Source IP addresses, Destination IP addresses, Snort Events, and Snort Rule sets.
Contents
Loading Bar
<figure id="fig:hist_rep_status">
</figure>
As soon as the window is created, the system starts querying the database for events that have occurred within the last day. As the events are loaded and processed by the browser, the loading bar shows the progress as illustrated in <xr id="fig:hist_rep_status"/>. While data loads and the amount decreases, the blue bar will grow smaller. If the bar is partially or all green, then events are still being processed. When the amount decreases, the loading bar will empty. Occasionally, the bar may fill back up again to indicate how many records are in the processing queue.
Historical View Columns and Data
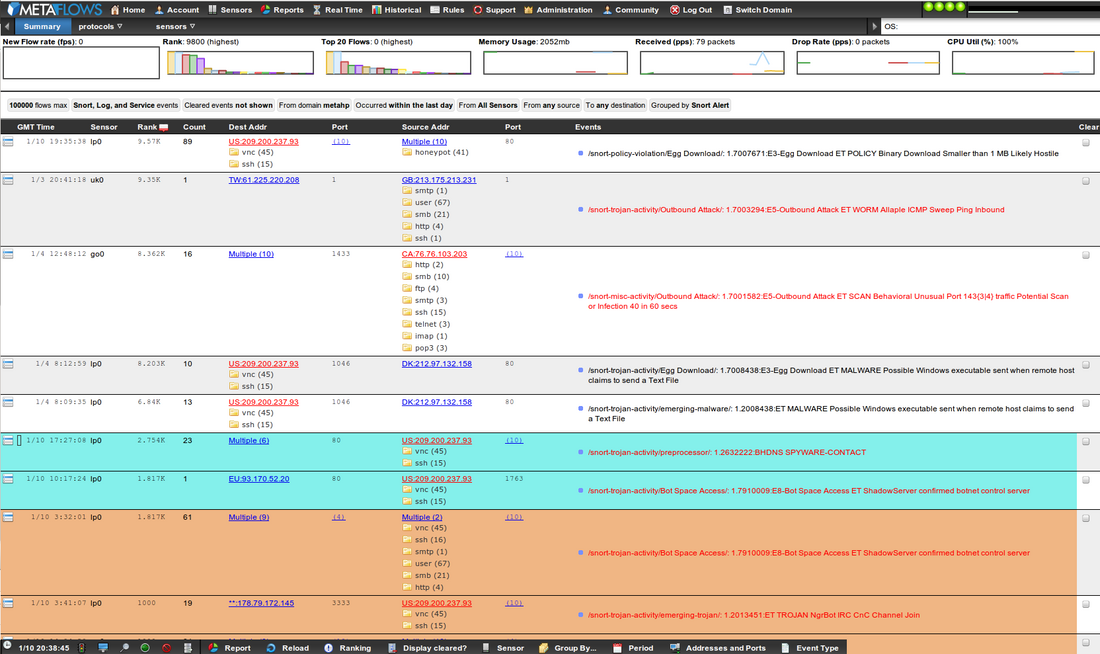
A sample Historical View is shown in <xr id="fig:hrep_intf"/>. Please reference Event Graphs for an explanation of the graphs at the top. The rows can be sorted by selecting the corresponding column header. Right clicking on each row provides a menu that offers options for further analysis of each row (please see Forensic Tools for details). The Historical View also creates a classification interface that allows highlighting and/or selective display of data using user-defined classes (see Event Classification for more details). For each summary event the report shows the following data: <figure id="fig:hrep_intf">
</figure>
- <TZ> Time - This displays the date (MM/DD) and time (HH:MM:SS) the event record was created in the time zone selected in the Account Preferences.
- Sensor - This identifies the sensor from which the event was collected.
- Rank – This shows the priority of the flow with respect to global event ranking.
- Count – This is the number of events summarized by each row.
- Server/Client Address – This is the IP Address for the server/client. If more than one server/client is summarized by the row, a link with the number of unique servers/clients will be displayed. Selecting the link shows the server/client information in a pop-up within the window.
- Logs/Services - Below the source/destination address, any recent syslog (red icon) or service discovery (yellow icon) events that are associated with the address(s) will be displayed.
- Source/Destination Port - This identifies the source/destination ports summarized by the record. If more than one source/destination port is summarized by the row, a link with the number of unique ports is shown. Selecting the link shows the ports in a popup within the window.
- Events - This lists the events that are associated with each flow.
- Clear - This allows the user to clear an event from appearing in the historical interface and tag it as a true positive, false positive, or irrelevant event.
Passive Discovery Information
Host
Hovering the mouse over any of the IP addresses will reveal information about that host that was discovered:
- DNS displays known DNS names of the host.
- OS displays our best guess of the type of operating system of the host.
- Agent displays http user agents employed by the host or any beaconing behavior of the host (see below).
- USR displays any know email or user names associated with a specific host.
- APPID displays what OpenAppIDs where associated with this host.
- VLAN displays in what VLAN the IP addresses appeared.
Due to the dynamic DHCP IP assignment or Network Address Translation, the IP address may have multiple instances of conflicting information. All of the records are listed separated by commas.
Beaconing
This passive detection behavior discovers if a host behaves like a covert beacon. A beacon sends messages at regular intervals to one or more servers to either export information to those servers or make its status known over time. Beacons have been associated with malware reporting to command and control centers. Therefore, it is an important clue when investigating a host.
Beacon messages have the format:
beacon <port>(<beacons>) score=<score> w=<start>-<end>(<window>) p=<period> stdv=<stdv> servers=<ip1>(<numc1>),<ip2>(<numc2>)
In which:
- <port> is the destination TCP or UDP port to where the beacon is transmitting.
- <beacons> is the number of beacon messages observed.
- <score> is a relative value indicating how likely the beaconing behavior is a predictable covert channel - it is calculated as: (period)*(number of flows)/(number of servers contacted)/(standard deviation).
- <start> is the UTC of the first observation.
- <end> is the UTC of the last observation.
- <window> is the duration of the observation (<end>-<start>).
- <period> is the average period between beacon messages.
- <stdv> is the standard deviation between beacon message intervals.
- <ip1>,<ip2>, etc. are the IP addresses of the beacon servers.
- <numc1>,<numc2>, etc. are the number of different beacon clients from which each server is receiving messages.
Feedback
<figure id="fig:fback_mech">
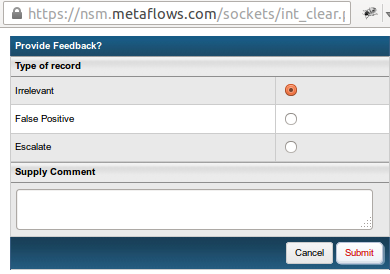
</figure> The feedback mechanism (shown here in <xr id="fig:fback_mech"/>) allows users to send comments detailing why records have been cleared. Using this data allows for more precise event relevance on a global, domain, and per sensor basis.
Coloring
The events shown in the Historical Reports may match our global correlation database. Each event and each IP address are compared to our current global correlation information base as they are loaded.
- IDS event IDs or IP addresses that are expected to have resulted in a compromise are colored red.
- IDS event IDS that are expected to be false positives are colored blue.
Note that some of the colorization may be hidden if it happens with a record with multiple entries such as (100), shown in <xr id="fig:event_rank"/>.
<figure id="fig:event_rank">
</figure>
Historical View Options
At the bottom of the Historical View Interface, there are several options which allows the user to customize what data they wish the view to display or generate additional report types. <figure id="fig:hist_query">
</figure>
- Current Time
- displays the time in the time zone set in the Account Preferences.
- Sensor Connection Manager
- allows managing the real time connection with the sensor. if the LED on the top right is blue or green, this option should not be used.
- Classification Editor
- Allows adding/removing or editing event classifications. See Event Classification for more information.
- IP Search
- Allows searching for a particular IP address in the historical view.
- Vulnerability Scan
- Allows initiating a vulnerability scan. The scan occurs from an external server located in the Amazon EC2 Oregon region.
- Block an IP address
- Allows entering a 32-bit IPv4 address for blocking it using SoftIPS.
- Export to CSV
- Generates a Comma-separated output of the view to be download with the browser.
- Generate Report
- Generates an HTML and PDF report from the data contained in the current page. The report will be added to the recurring reports stored on the server.
- Event Query Specification
- By selecting any combination of options and then clicking on the reload icon, the view can be further customized.
The fields shown in <xr id="fig:hist_query"/> have the following meaning:
- Display Cleared - If checked, this will display all historical events even when they have been cleared by yourself or another user.
- Aggregate By - This allows changing the aggregation strategy from the default strategy (best).
- Destination - This prevents aggregating by the client IP address, thus reporting a summary of events for each client address.
- Server - This prevents aggregating the event data by the server IP Address, thus reporting a summary of all events caused by all servers.
- Event - This prevents aggregating by similar Events.
- Category - This prevents aggregating by event categories.
- Best - This is the default aggregation. Using this method, the interface tries to minimize the total number of rows - the mode can also be used to discover unforeseen data aggregations automatically.
- Period - This defines the age of the view or the Start and End dates.
- Sensor Name - This displays events from a specific sensor only.
- Client/Server Address - This displays records with match specific IP addresses. The order in which addresses are entered is irrelevant since the query will return records with specified addresses as either the server or the client.
- Source/Destination Port - This displays records with a specific source and/or destination port.
- Event Type - This allows the user to select specific IDS events, specific Syslog events or specific service discovery events.
- IDS events can be queried from individual rule files, event classifications, or specific GID or SID.
- Syslog events can be queried by the categories or can be queried using a string search. In addition to the standard syslog categories, the following MetaFlows-specific events can be queried:
- File-Inbound/Outbound: This indicates any file transmission detected coming in or out of your network.
- Tracker: This forms multi-session incident reports.
- BotHunter: These are dialog-based incident reports.
- MssBlock: These are SoftIPS blocking reports.
- ModSecurity: These are ModSecurity Alerts.
Selecting the Reload button will regenerate the view report.
| Previous Chapter | Next Chapter |
 1 (877) 664-7774 - support@metaflows.com


