Sensor Software Install
The previous chapter described the steps required to instantiate and configure a sensor. The following sections describe the procedure for downloading the sensor software and installing it on Linux or as a VMware virtual machine.
Contents
- 1 Downloading Sensor Software
- 2 Linux Sensor Software Installation Procedures
- 3 VMware Appliance Installation Procedures
- 3.1 Configure Share Folders
- 3.2 Virtual Machine Sensor Management
- 3.3 Resources to Dedicate to a Virtual MSS sensor
- 3.4 Configure VMware ESXi to Monitor External Mirrored Traffic
- 3.5 Configure VMware ESXi to Monitor a vSwitch
- 3.6 Monitoring both External Mirrored Traffic and Internal vSwitch Traffic
- 4 Interface Bonding
- 5 Firewall Setup
- 6 Real-Time Email Alerts
Downloading Sensor Software
The View Sensors page will display links for the VMWare and Linux downloads as shown in <xr id="fig:sensor_download"/>. For a 32/64-bit Linux CentOS or Red Hat operating system, select the Linux link. For any other operating system, select the VMware option. Download the VMware or Linux zip file and save it in a place where you can easily locate it when the download completes. You will then need to copy the zip file to the disk of the machine on which you wish to install the sensor.
<figure id="fig:sensor_download">
</figure>
Linux Sensor Software Installation Procedures
We require Linux CentOS/Red Hat 64 bit Operating Systems. As root execute the following commands:
unzip linux.zip
cd nsm
./setup.sh
In most cases, you should answer yes to all the questions.
The setup.sh script requires that the machine on which it is run have a correctly configured network since a number of the operations require the download of packages from the internet. This script will also post to MetaFlows some debugging information to facilitate installation support in case something goes wrong. The MSS installation is a very complex process. MetaFlows has put a lot of effort in minimizing installation problems. However, given the high level of complexity in modern system design, some installation problems may emerge. Typically, these can be resolved easily by MetaFlows and once installed the system is extremely stable. We therefore strongly encourage users to promptly contact support@metaflows.com with any installation problems. After the setup.sh script terminates successfully, you will not need to run it again. You can now start the sensor with:
/nsm/etc/mss.sh start
Each time the MSS starts, it downloads the latest binaries and the latest security updates and rules. This command requires the machine to be connected to the internet.
Initial Boot Up
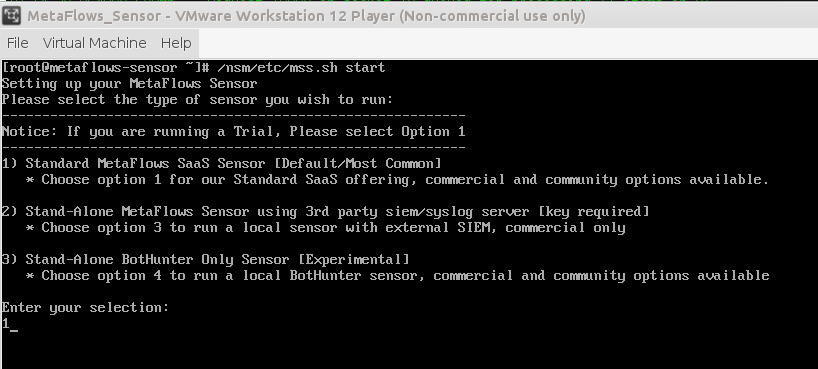
The first time the sensor starts you will be asked to select which type of sensor you are trying to run, this should be Option 1 "Standard MetaFlows SaaS Sensor" in most cases. The other two options will be covered under the alternative deployments section.
After selecting option one, you will be prompted for your MetaFlows account User ID and Password. You will also be asked to "Enter the sensor number from the list above." The number requested will be located just below the "Password" field. See <figure id="fig:vmware_bootup">.
</figure>
This configuration step assigns a unique identifier to the machine where the MSS is starting. Once the ID is assigned (in /nem/etc/UUID), this step will not be repeated again unless the user purposely resets the association by setting the sid variable to 0 in the file /nsm/etc/UUID.
NOTE Changing the sensor configuration on the website through the sensors menu form does not require the re-installation of the sensor. Any configuration change can simply be reflected in the running sensor by issuing the command /nsm/etc/mss.sh restart. Each time the sensor restarts, the complete configuration is rebuilt from scratch using a phone-home mechanism. IDS Rule configuration changes apply automatically every twelve hours without user interaction. IDS Rule configuration changes can also be applied by selecting the Reload icon in the rule configuration menu (which does not cause a restart, but simply a rule reload).
VMware Appliance Installation Procedures
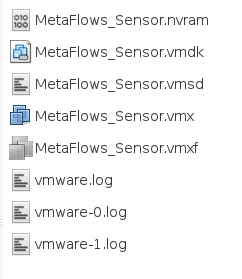
Unzip the downloaded MetaFlows_SensorVM-2.0.zip file. The contents of the download are displayed here:
<xr id="fig:vm_download"/>. Extract all files to a convenient location. Double-click the MetaFlows_Sensor.vmx file that you extracted or open it directly from your vmware product.
<figure id="fig:vm_download">
</figure>
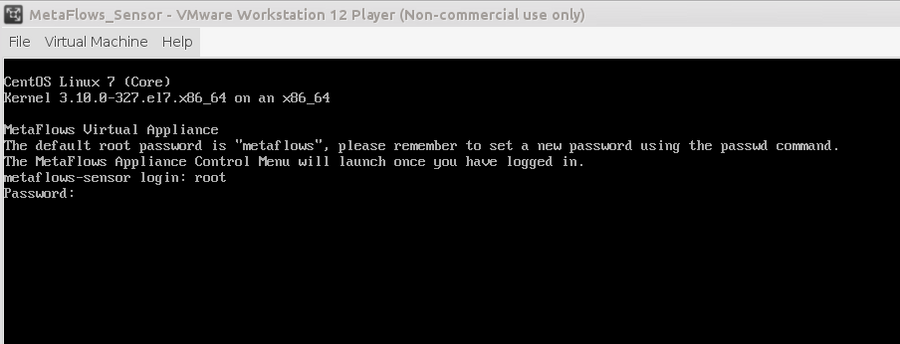
When the VMware appliance has finished booting, you will log in using the default username "root" and the password "metaflows" <figure id="fig:vm_login">
</figure>
Initial Start Up
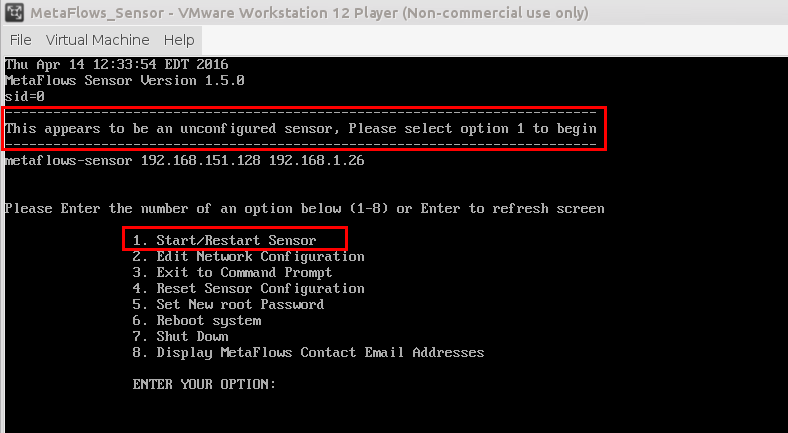
The first time you log in to the VMware appliance, you will be presented with the appliance control menu. Since the sensor is in an unconfigured state, please enter option 1 to begin the configuration.
Next, you will be asked to select which type of sensor you are trying to run. This should be Option 1 "Standard MetaFlows SaaS Sensor" in most cases. The other two options will be covered under the alternative deployments section.
In order to retrieve your sensor configurations, you must enter your MetaFlows account User ID and Password. You will then be asked to "Enter the sensor number from the list of sensors you have previously configured." The number requested will be located just below the "Password" field.
This configuration step assigns a unique identifier to the machine where the MSS is starting. Once the ID is assigned (in /nem/etc/UUID), this step will not be repeated again unless the user purposely resets the association by setting the sid variable to 0 in the file /nsm/etc/UUID.
Note that changing the sensor configuration on the website through the sensors menu form does not require the re-installation of the sensor. Any configuration change can simply be reflected in the running sensor by issuing the command /nsm/etc/mss.sh restart. Each time the sensor restarts, the complete configuration is rebuilt from scratch using a phone-home mechanism. IDS Rule configuration changes apply automatically every twelve hours without user interaction. IDS Rule configuration changes can also be applied by clicking on the Reload icon in the rule configuration menu (which does not cause a restart but simply a rule reload).
Setup Complete
When the sensor has finished downloading the configuration and the latest plugins, it will return you to the menu.
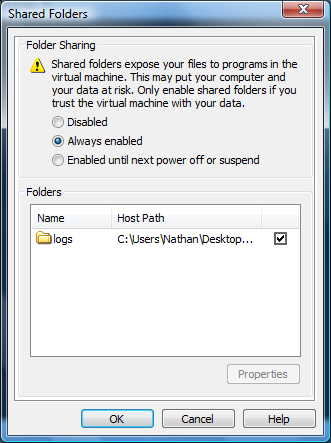
This optional procedure is to allow the MetaFlows system to use the physical hard drive on the host to store the packet logs. We recommend reserving at least 500 GB of disk space for the logs. <figure id="fig:vm_folder">
</figure> Once the startup process is complete, click on the ‘Virtual Machine’ drop down menu – select ‘Virtual Machine Options'. Under the ‘Options’ tab, click on ‘Shared Folders’ and set to ‘Always Enabled’ as displayed in <xr id="fig:vm_folder"/>. You need to do this in order to store the logs generated by your sensor.
If there are no folders in the "Folders" window (see <xr id="fig:vm_folder"/>), you will need to click the "Add" button to launch the VMware Add Shared Folders Wizard. In the Wizard, in the "Host" field, choose a file path that will be convenient for you to access system logs. Click "Browse" to choose a location on the machine's hard drive. Under the "Name" field, choose a name for this location (this can be anything that makes sense to you).
Note that it is recommended that you reserve several gigabytes of disk space for the logs. You can also create a new directory using the create folder command.
Virtual Machine Sensor Management
<figure id="fig:vm_sensor_mgmt">
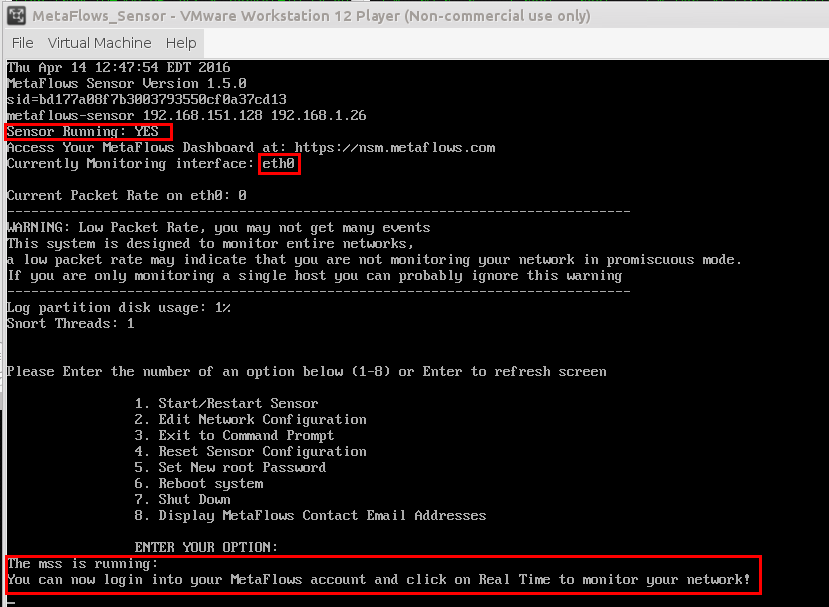
</figure> When you run the VM.vmx virtual machine, it will automatically start all sensor processes and display debug and status information to the virtual machine console. To clear the screen simply press Enter. The console should display a screen like the one shown in <xr id="fig:vm_sensor_mgmt"/>.
This is a simple menu-based sensor management interface. Different actions are invoked by selecting the corresponding number and pressing Enter.
- Start or Restart the Sensor Software
- Edit the Network Configuration
- Exit to the Command Prompt
- Reset the Sensor to an Unconfigured State
- Set a New Root Password for the Sensor
- Reboot the VM Appliance
- Shut Down the VM Appliance
- Display Contact Information for MetaFlows Support
You can log in to the virtual machine by entering 1 and then logging in as user root and using the same password you use to log in to your MetaFlows account. You can also ssh into the sensor by noting the IP address of the virtual machine and executing:
ssh root@<IPaddress>
To get the IP address of your sensor, you can select option two or execute the following in the VMware Player console:
ifconfig eth0
Resources to Dedicate to a Virtual MSS sensor
The communication, computing, and storage resources needed by a virtual sensor are exactly the same as the one needed by a physical sensor. It is particularly important to note that unless it is desired to only monitor the traffic on the host where the MetaFlows VM is running, it is necessary to feed external mirrored traffic on a dedicated physical Ethernet adapter. Such dedicated physical adapter will be connected to a dedicated switchport and in turn connected to the MetaFlows secondary promiscuous interface.
Configure VMware ESXi to Monitor External Mirrored Traffic
- Step 1
- Select the physical ESX server in VMware vSphere client. Select Configuration -> Networking, and then
select Add Networking.
- Step 2
- The Add Network Wizard is launched. Under Connection Types, choose Virtual Machine, and click Next.
- Step 3
- Select the Physical Interface that will be connected to the mirror port on the switch, and click Next.
- Step 4
- Name the network Mirror_Session or any other name.
- Step 5
- Select Finish.
- Step 6
- To enable promiscuous traffic on the newly created virtual switch, select Properties.
- Step 7
- Highlight the new virtual switch and select Edit.
- Step 8
- Select the Security tab, and then select Accept from the Promiscuous Mode drop-down menu and click OK.
- Step 9
- Close the vSwitch Properties window.
- Step 10
- Edit the MetaFlows Virtual Machine settings.
- Step 11
- Select the appropriate Network Adaptor for MetaFlows (usually the second Network Adaptor).
- Step 12
- Ensure that the Device Status is set to Connected and that Connect at Power On is also enabled.
- Step 13
- From the Network Connection drop-down menu, select the newly created Mirror_Session network.
- Step 14
- Click OK.
- Step 15
- Note the name of the network adaptor used in Step 11 and configure it as the Promiscuous Interface name in the sensor configuration form on nsm.metaflows.com.
Configure VMware ESXi to Monitor a vSwitch
This procedure is to monitor traffic internal to the physical host.
- Step 1
- Select the physical ESX server in VMware vSphere client.
- Step 2
- Select Configuration -> Networking, and then choose your vSwitch and click Properties.
- Step 3
- In the vSwitch Properties window, in the Ports tab, click Add at the bottom left.
- Step 4
- The Add Network Wizard is launched.
- Step 5
- Name the port group Internal_Mirror_Session or any other logical name.
- Step 6
- Set the VLAN to 4095 and click Next. Note: This VLAN is a special VMware VLAN that listens to all other VLANs on that vSwitch.
- Step 7
- Select Finish.
- Step 8
- Highlight the new port group.
- Step 9
- Choose Edit.
- Step 10
- Select the Security tab.
- Step 11
- Select Accept from the Promiscuous Mode drop-down menu.
- Step 12
- Click OK.
- Step 13
- Close the vSwitch Properties window.
- Step 14
- Edit the MetaFlows Virtual Machine Settings.
- Step 15
- Select the appropriate Network Adaptor for MetaFlows (usually the second Network Adaptor).
- Step 16
- Ensure that the Device Status is set to Connected and that Connect at Power On is also enabled.
- Step 17
- From the Network Connection drop-down menu, select the newly created Internal_Mirror_Session network.
- Step 18
- Click OK.
- Step 19
- Note that the name of the network adaptor used in Step 15 and configure it as the Promiscuous Interface Name in the Sensor Configuration form on nsm.metaflows.com.
Monitoring both External Mirrored Traffic and Internal vSwitch Traffic
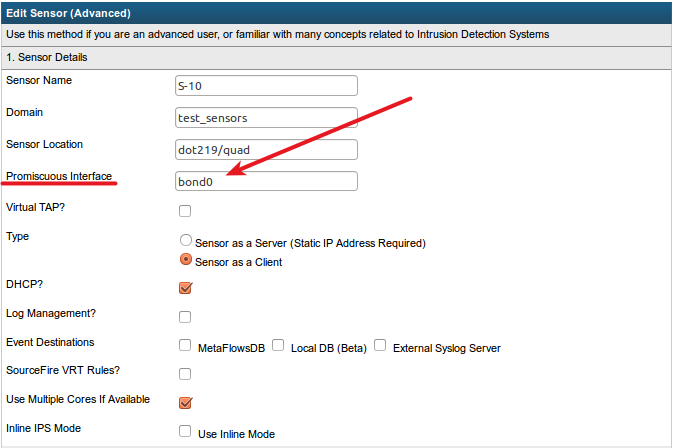
It is possible to monitor more than one source of promiscuous traffic whether it is received from one or more dedicated promiscuous physical adapters or a vSwitch plus one or more dedicated promiscuous physical adapters. To monitor multiple sources, simply follow the procedures outlined above to map the traffic to multiple adapters on the MetaFlows VM and then perform Bonding at the OS level. Then configure Bond0 as the Promiscuous Interface name in the Sensor Configuration form on nsm.metaflows.com.
Interface Bonding
The MSS software can monitor multiple promiscuous ports using Interface Bonding. The procedure below can be used to create a bonding interface on Linux CentOS/RHEL 6/7.
1. Add the bonding interface configuration.
Create a network script for your new bonding device. It is common practice to name this device 'bond0'. You will want to make sure that it has ONBOOT=yes as shown below.
# vim /etc/sysconfig/network-scripts/ifcfg-bond0
TYPE=Bond
DEVICE=bond0
BOOTPROTO=none
ONBOOT=yes
USERCTL=no
2. Edit the interface configuration for the interfaces you wish to bond.
Below are two examples of interfaces that will be added to our bond0 device. You can bond more than two interfaces if you wish - just use the same bolded options that are in use here. If these network scripts already exist, you will need to change them to match these examples (keeping their own HWADDR). They should be set to: ONBOOT=yes, MASTER=bond0, SLAVE=yes, USERCTL=no.
# vim /etc/sysconfig/network-scripts/ifcfg-eno2
DEVICE="eno2"
HWADDR="00:11:22:33:44:55"
NM_CONTROLLED="yes"
ONBOOT="yes"
MASTER=bond0
SLAVE=yes
USERCTL=no
# vim /etc/sysconfig/network-scripts/ifcfg-eno3
DEVICE="eno3"
HWADDR="99:88:77:66:55:44"
NM_CONTROLLED="yes"
ONBOOT="yes"
MASTER=bond0
SLAVE=yes
USERCTL=no
3. Add the bonding module options to the mod probe config.
For the purposes of monitoring multiple links with a MetaFlows sensor, bonding mode 0 appears to be the most appropriate. Adding this file will automatically load the bonding module when the bond0 interface is brought up.
# vim /etc/modprobe.d/bonding.conf
alias bond0 bonding
options bond0 miimon=100 mode=0
4. On CentOS 7, reload the network manager configuration files.
nmcli con reload
5. Restart the networking.
# /etc/init.d/network restart
Once restarted, you should be able to see the bond0 interface in ifconfig, and its slaves should be labeled as such. You can also get information about the bonding device and its slaves by reading the file /proc/net/bonding/bond0.
6. Change the sensor to monitor the bond0 device.
Firewall Setup
The sensor can be configured to operate in either client or server mode.
Listening Ports
At boot:
- tcp 22 - ssh
- tcp 25 - postfix (localhost only, also blocked by iptables by default)
- udp 514 - ossec (gets replaced by syslog_x when the sensor starts unless a flag is set)
- udp - dhclient
Added by the sensor software:
- tcp 843 - mss
- tcp 3000 - ntop
- tcp 3001 - mss
- tcp 3002 - mss
- udp 514 - syslog_x
- tcp and udp 3004 - syslog_x
Sensor as a Client
- Inbound ports are not required.
- The sensor needs to connect outbound on port 3003 to nsm.metaflows.com.
- The user's web browser needs to connect outbound on ports 3000-10000 to nsm.metaflows.com.
- When the sensor is configured as a client, it can be reached from anywhere where outbound ports 3000-10000 are allowed.
Sensor as a Server
- The user's web browser connects inbound to the sensor on ports 843, 3000-3003.
- When the sensor is configured as a server, the user's browser needs to be able to reach these ports from wherever you operate your browser.
Sensor Outbound Communications (Server Mode and Client Mode)
The Sensor must be able to communicate out to the following:
- nsm.metaflows.com, ports 80,443
- kb.bothunter.net, port 80
- api.mywot.com, port 80
- whois.arin.net, port 80
- tcp port 43
Additional Considerations
- The sensor should be able to resolve dns names.
- To use the SoftIPS feature, the sensor should be able to communicate to the internal hosts that are being protected.
Real-Time Email Alerts
If real-time event emails are desired that match any of the classification emails as specified in Email Classification Actions, add the following environment variable:
export emailaddress=youremail@yourdomain.com
This can be placed in the script /nsm/etc/mss.sh so that it will be set after rebooting or remote restarts of the sensor. The email will be in HTML to provide some hyperlinks to the addresses involved in the incident. If a text email is preferred, please also add:
export emailtype="text"
| Previous Chapter | Next Chapter |
 1 (877) 664-7774 - support@metaflows.com

