Sensor Provisioning and Configuration
Contents
- 1 Adding a Sensor
- 2 Sensor Configuration (Short Form)
- 3 Sensor Configuration (Advanced)
- 3.1 Log Management
- 3.2 Event Destinations
- 3.3 Use Multiple Cores If Available
- 3.4 Use Inline Mode
- 3.5 Sensor Variables
- 3.6 Sensor Application Details
- 3.6.1 OpenAppID
- 3.6.2 Flow Analysis and Passive Service Discovery
- 3.6.3 Network Analysis and File Carving
- 3.6.4 Malware Analysis (BotHunter)
- 3.6.5 Passive OS Fingerprinting
- 3.6.6 Storing Packets on the Sensor
- 3.6.7 Block Communications in Passive Mode (Soft IPS)
- 3.6.8 File Monitoring
- 3.6.9 Passive ModSecurity
- 3.7 Automatic Blocking for Priority Rules
- 3.8 Manage Local Rule Source
Adding a Sensor
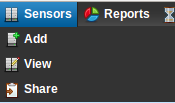
Click the "Add a Sensor" button on the homepage of the Dashboard or from the "Sensors" drop-down menu, select "Add" as shown in <xr id="fig:sensor_drop"/>.
<figure id="fig:sensor_drop">
</figure>
The sensor configuration and customization detail form is displayed next. This configuration is stored in secure web space and can be modified at any time in the future.
Sensor Configuration (Short Form)
<figure id="fig:sensor_summary">
</figure>
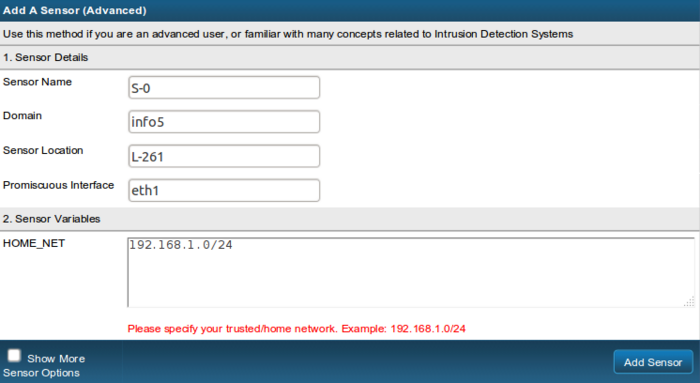
The short form allows the addition of a sensor by just specifying essential parameters required for proper operation. This short form sets a large number of values to a default value that should work for most installations. MetaFlows recommends using this for the short form initially and then modifying the sensor configuration later (if required) by clicking on sensor->view and modifying the sensor by clicking on its name and then clicking on Show More Sensor Options to reveal the advanced options.
The Sensor Name, Domain, Sensor Location are pre-filled in with some predefined values that can be modified to match your preference. If you do not want to use the system defaults, simply edit these fields with some names that make more sense to you.
The Promiscuous Interface and the HOME_NET fields are very important and need to be modified to match your particular installation. We picked values that are very common but please verify their correctness before proceeding. If you do not enter correct values, your sensor will not run.
Sensor Configuration (Advanced)
Selecting Show More Sensor Options reveals the advanced sensor settings for users who are familiar with networking and familiar with many concepts related to Intrusion Detection Systems (IDS).
<figure id="fig:sensor_details">
</figure>
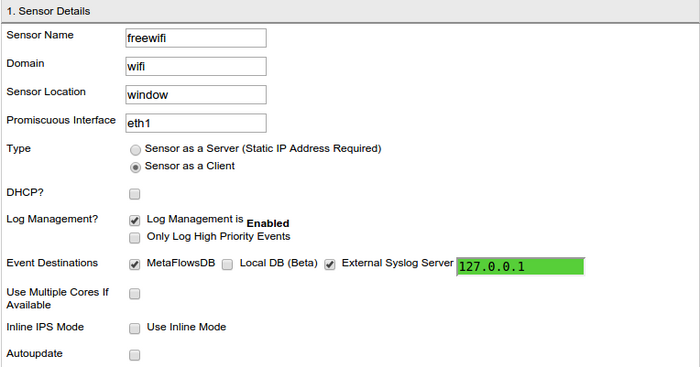
The sensor details form is shown in <xr id="fig:sensor_details"/>. Note Based on the options you have selected, your form might look slightly different. This section explains all possible fields of the form.
- Sensor Name This is your text name for the sensor you are creating. This is usually the hostname where the sensor is installed.
- Domain This is the domain that groups all your sensors under one administrative domain. You should pick a domain such as mysensors or mycompany.com and use it for all sensors you add. Note that this field is not related to your actual company domain name or web address. This will not be used for DNS queries, so you can pick any name that makes sense to you.
- Sensor Location This denotes the location of your sensor, or another label you would like to use to identify the sensor.
- Promiscuous Interface This is the name of the interface the sensor will be monitoring packets from. Usually this field is eth1. Promiscuous Mode refers to a configuration of your network card (or virtual network interface) to allow packets to be sent to packet sniffing programs. You can learn more about Promiscuous Mode here
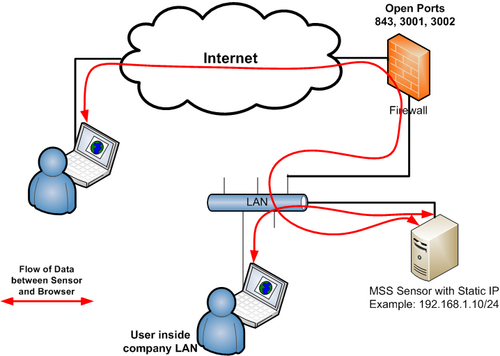
- Sensor as a Server In Server Mode, the sensor accepts connection from the browser directly. Enabling this option would permit you to monitor your sensor from outside your firewall. If you need to monitor your sensor from outside a firewall, you need to open/forward ports 843, 3001, 3002 from/to the sensor. The advantage of this mode is that the sensor real time data will go directly to your browser. Click on this button if you would prefer to assign a Static IP address and use this mode. When you select this option, the browser adds a Real Interface Configuration section that you need to complete. The flow of data for Sensor as a server is shown in <xr id="fig:sensor_server"/>.
<figure id="fig:sensor_server">
</figure>
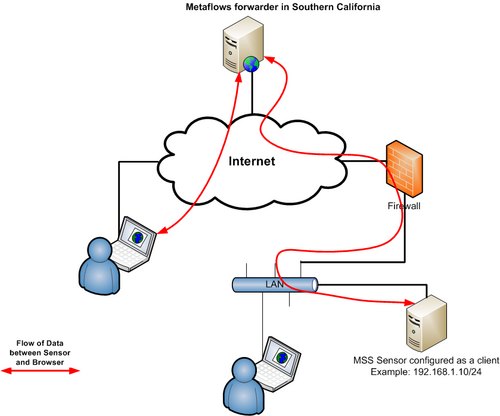
- Sensor as a Client In client mode, the sensor uses outgoing connections to MetaFlows' forwarder so that browsers from outside your firewall can securely connect to it. This mode does not require any additional system configurations. The drawback of this mode is that the sensor real time data will always route through MetaFlows forwarder (located in Southern California) even though your browser might be closer to the sensor. If you select this option, you will be given an additional button DHCP as shown in <xr id="fig:sensor_details"/>. The flow of data for Sensor as a Client is shown in <xr id="fig:sensor_client"/>
<figure id="fig:sensor_client">
</figure>
- DHCP Selecting DHCP mode implies that you have a DHCP server on your network which assigns IP addresses automatically to clients requesting them.
<figure id="fig:real_interface">
</figure>
In this form, shown in <xr id="fig:real_interface"/>, you will specify the Static IP addresses, name servers, and other details as explained below. You will not see this form if you have chosen the DHCP option in the previous section
- Static IP IP address to reach a non-natted sensor. Ports 3001, 3002, and 843 need to be open or forwarded to this IP.
- Subnet This is the netmask or network mask of your real network interface. It determines which portion of your IP address is divided into subnetworks, and which portion is used to allocate actual machine addresses. It is usually of the form 255.255.255.0. Contact your IT administrator if you are not sure of this mask.
- Gateway This is the IP address of the gateway that your systems access the internet through.
- Nameserver 1 This is the Domain Name Server (DNS) address (DNS) for name resolution.
- Nameserver 2 The alternate or additional DNS server IP address can be specified here.
Log Management
Select the Log Management option if you wish to send syslog messages to the sensor. The sensor will normalize these messages and correlate them with the other security messages. The logs can can be sent from any device (including other Snort sensors) as long as they use standard syslog format. OSSEC syslog messages are particularly helpful and we highly recommend feeding them to the sensor.
Event Destinations
- MetaFlows DB This is the default event destination, all events will be sent to the MetaFlows cloud to be correlated and stored in our databases. Most users should leave this option checked.
- Local DB (Beta) The Local DB option logs events to a MySQL database that is running on the sensor. This allows events to be fetched from the local system instead of from our cloud. Some users with specific privacy concerns may wish to try this option. Note that some features are dependent on our correlation and cloud storage systems and so may work while running in local DB mode.
- Syslog Server The sensor can send events to an external syslog server. An example of the exported syslog is:
Feb 29 17:12:09 S-0.tcovel: {1,0} [1:2009375:3] ET CHAT General MSN Chat Activity {IP} 211.122.190.171:1730 <- 93.42.235.179:80 Feb 29 17:12:09 S-0.tcovel: {2,0} http:Server: Microsoft-IIS/6.0 {IP} 211.122.147.127:80 -> 63.251.63.121:3083
The format is: syslogdate> <sensor>.<domain> {<evtype>,<rank>} <msg> {<proto>} <srcip>:<srcport> <dir> <dstip>:<dstport>
where:
syslogdate=event time sensor=sensor name domain=sensor domain (usually one per customer location) evtype=1 or 2. 1=snort/BH. 2=service discovery. rank=priority. <0: false positive. 0: normal. >0 high threat msg=event message proto="IP" dir="->" or "<-" srcip,dstip,srcip,dstip=flow
Additional Details about the Local DB Mode
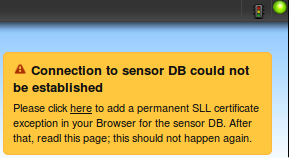
In order to use the localdb, you will have to accept an ssl certificate the first time that your browser connects to the sensor.
1. When you see this notification, click the link provided to go to the certificate page.
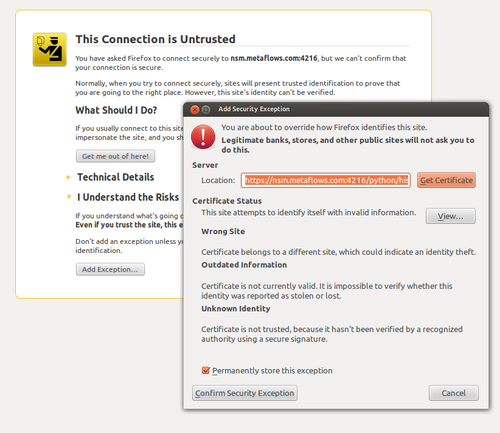
2. The certificate will appear as untrusted because you are using nsm.metaflows.com but the certificate is a self-signed certificate for your local sensor. If you are using Firefox, click "Add Exception and then "Confirm Security Exception".
3. Once accepted, the page should display a message showing that everything is setup correctly.
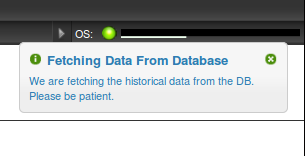
4. Now when you do a historical query, you should see the following message.
Use Multiple Cores If Available
Select Use Multiple Cores If Available if you want to run Snort parallel to achieve performance greater than 100Mbps. If you check this box, the sensor will spawn multiple instances of IDS/IPS processes to achieve performance greater than 100 Mbps.
Use Inline Mode
Select the Use Inline Mode option if you would like to run the sensor inline. When running the sensor inline, packets are forwarded between the interfaces specified at Layer2. The sensor will not require additional IP addresses as the packets are bridged transparently. In Inline Mode, any drop IDS rule will cause the packets not to be forwarded. After you check this option, you have to specify the interfaces which will be your input and output port.
Sensor Variables
<figure id="fig:sensor_vars">
</figure>
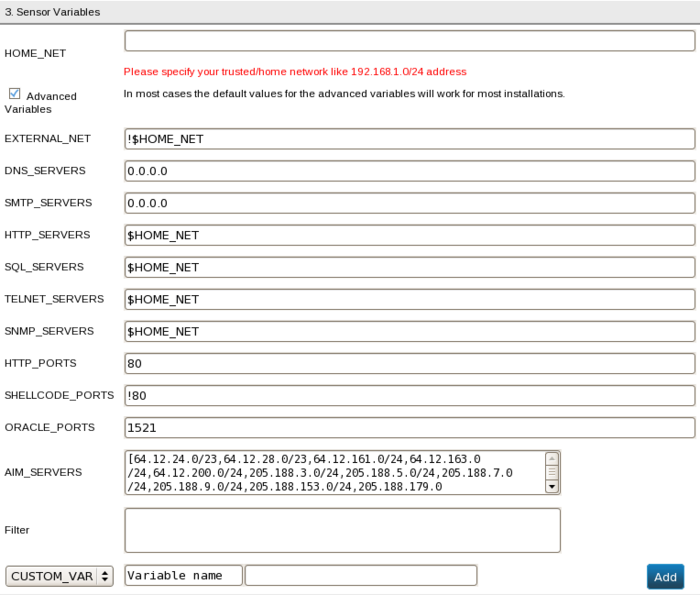
In this screen, shown in <xr id="fig:sensor_vars"/>, you will set the variables used to configure Snort and other packet monitoring devices on the sensors.
- HOME_NET This should identify the network address of the network you are monitoring and or protecting. Examples of HOME_NET variables are: 192.168.1.0/24 or [192.168.0.0/16,10.0.0.0/8]. Notice that you can list a number of network addresses if you have more than one subnet. This is the single most important parameter. If you do not know what this should be, please ask your IT or network support team.
- Advanced Variables Beginning users are recommended to disable this option. The built in defaults for advanced variables will work for most installations. If you are an IDS expert, you can enable this button and you will see an expanded form as shown in <xr id="fig:adv_vars"/> below.
<figure id="fig:adv_vars">
</figure>
- EXTERNAL_NET This is usually the IP addresses external to your organization. This should be set to !$HOME_NET unless you really know what you are doing.
- DNS_SERVERS This is the list of IP addresses of Domain Name Servers (DNS) being used in your network (such as [192.168.1.1,192.168.2.1]). If you do not know their addresses, leave this as 0.0.0.0. If you set DNS_SERVERS to $HOME_NET or any, there is a high probability that false positives will be generated (alerts that should not be generated).
- SMTP_SERVERS This is the list of IP addresses of email servers being used in your network (such as [192.168.1.1,192.168.2.1]). If you do not know their addresses, leave this as 0.0.0.0.
- HTTP_SERVERS This is the list of IP addresses of web Servers being used by your network (such as [192.168.1.1,192.168.2.1]). This could also be a network address such as 192.168.1.128/23. If you do not know this, leave this as $HOME_NET.
- SQL_SERVERS This is the list of IP addresses of SQL servers being used by your network (such as [192.168.1.1,192.168.2.1]). This could also be a network address such as 192.168.1.128/23. If you do not know this, leave this as $HOME_NET.
- TELNET_SERVERS This is the list of IP addresses of telnet servers being used by your network (such as [192.168.1.1,192.168.2.1]). This could also be a network address such as 192.168.1.128/23. If you do not know this, leave this as $HOME_NET.
- SNMP_SERVERS This is the list of IP addresses of SNMP Servers being used by your network (such as [192.168.1.1,192.168.2.1]). This could also be a network address such as 192.168.1.128/23. If you do not know this, leave this as $HOME_NET.
- HTTP_PORTS This is the list of ports that host HTTP services (web server) in your network. 80 or [80,8080] are very typical values.
- SHELLCODE_PORTS This is the list of ports you want to monitor for SHELL Code exploits. !80 is a very typical value since shellcode does not work on HTTP servers while all other ports are at risk.
- ORACLE_PORTS This is the list of ports Oracle servers use. 1521 is a very typical value. If you have a non-standard configuration, you can list the ports using the syntax [a,b,c].
- AIM_SERVERS: This variable lists the AIM servers and should not be modified unless you have a non-standard AIM configuration. The default value is [64.12.24.0/23,64.12.28.0/23,64.12.161.0/24,64.12.163.0/24,64.12.200.0/24,205.188.3.0/24,205.188.5.0/24,205.188.7.0/24,205.188.9.0/24,205.188.153.0/24,205.188.179.0/24,205.188.248.0/24].
- Filter This variable is a filtering expression to ignore packets not interesting to the sensor or that generate excessive data. The filter expression is a Pcap expression (please see the official tcpdump documentation for more information about Pcap expressions). An example filter expression is
not host 10.10.1.253 and not host 192.12.33.100 and not host 192.1.33.102
This example will ignore hosts 10.10.1.253, 192.12.33.100, and 192.1.33.102. Notice that you do not need quotes. As you are typing, the expression is validated in real-time and the text-box changes color to red if incorrect and to green if it is correct.
- CUSTOM_VAR If you are running your own Snort rules and have custom variables, you can define them as custom variables. Once you have added variables, you can click on the "Delete" button next to each variable to remove it. You may only add one instance of each variable. Multiple instances of a custom variable must have different names. For example:
MAX_DISK. This custom variable can be used to set the maximum number of bytes of all MetaFlows logs on the sensor. The default is 10 gigabytes. For example, to increase the default to 100 gigabytes one would enter
MAX_DISK=100000000000.
Sensor Application Details
<figure id="fig:sensor_app">
</figure>
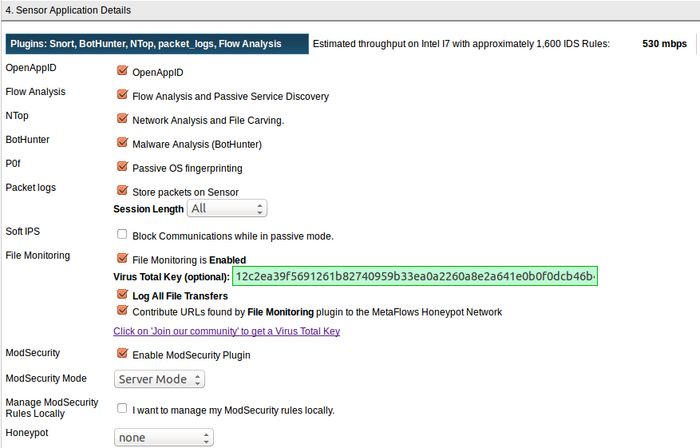
As shown in <xr id="fig:sensor_app"/>, several detection options are available. Typically, all of them should be checked to get the most out of the system. In some cases, it is desirable to disabled some of them for performance reasons or for policy reasons.
OpenAppID
Cisco released OpenAppID, their answer to Palo Alto Networks’ AppID feature, which allows administrators to know exactly what applications are running in the network. OpenAppID results appear as an additional field in the IDS alerts to give better context for the alerts. We also gather this information to associate it with the internal host IP addresses, whether or not they generate an IDS event. This new feature requires 40% more memory and in some cases, even though we install it, the system automatically turns it off if you do not have enough memory. You need at least 2 GB RAM per core.
Flow Analysis and Passive Service Discovery
This function gathers flow data for (1) detecting certain types of data exfiltration attempts using Correlation Engine Rules and (2) displaying real time flow information through the Real Time View. The Real Time View has a unique flow aggregation algorithm that simplifies flow analysis by automatically choosing the most efficient invariant of a set of flows. This automatically highlights patterns that show scans or anomalous uses of network bandwidth or flow distribution.
For example in the screen shot above we show the aggregates that are using the most packets. The web server 139.182.127.247 is using most of the bandwidth serving 3 clients while 6 hosts are accessing server 52.8.119.146 to play online games.
Network Analysis and File Carving
File Carving extracts files from the traffic being transmitted across your network. This is an important analysis feature which allows the investigator to close the loop on suspected downloads, payloads from exploits, or policy violations, and to categorically identify malicious behavior or data exfiltration activities. Please see the Historical Flow and Payload Data interface for further details.
Malware Analysis (BotHunter)
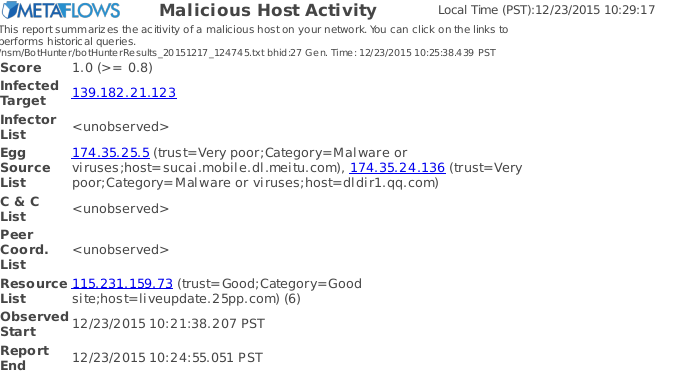
This is one of the most important features of our system. Please see the multiple session analysis description to learn more.
For example the screen shot above show an incident report automatically generated by this Malware analysis function. It shows that an internal host 139.182.21.123 has downloaded some malware from 2 separate sites with very poor reputation and also exhibited some suspicious communication behaviour with liveupdate.25pp.com. These types of reports are essential in catching and shutting down compromised hosts.
Passive OS Fingerprinting
Passive OS Fingerprinting attempts to discover what OS version the hosts are running by analyzing the way they communicate. This information can be helpful to understand how the security alerts affect a particular host based in its OS type and version. This option does not consume much CPU so it is always safe to leave it on.
Storing Packets on the Sensor
Using this configuration option, it is possible to disable full packet logging in favor of session storage. Session storage of the first 512, 1024, 2048, or 4096 bytes of a flow instead of full packet capture which will reduce storage requirements by approximately two orders of magnitude for the same backtracking time (or conversely increase backtracking time for the same amount of storage). Session storage might miss some information but has a high probability of catching desirable payload which usually is in the first few hundreds of bytes of a session. In case session storage is not chosen through the sensor configuration page, an additional sessions packet store is enabled automatically to always provide at least one historical session flow data database.
Block Communications in Passive Mode (Soft IPS)
MetaFlows Soft IPS technology blocks unwanted traffic in passive mode. Soft IPS does this by injecting spoofed TCP packets into the network to disrupt unwanted communications. This idea (also employed by the Great Firewall of China) is coupled with a new algorithm that will safely predict what traffic to block based on observed communication patterns. No rules are set to trigger IPS by default; so it is safe to enable this.
File Monitoring
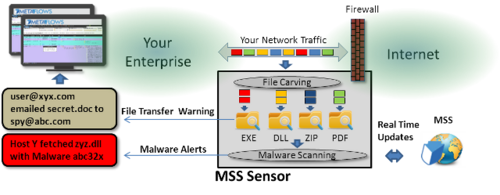
The MetaFlows Security System (MSS) sensors reassemble interesting files being transmitted on your network (both inbound and outbound) on ports 25, 80, 110, and port 143. These are the ports through which most malware is propagated with browser-based exploits, Phishing, or email spam.
As shown in the diagram, all dangerous file transmissions (exe, dll, MS Office, pdf, zip, etc.) are logged and correlated whether or not they are malicious. This allows you to see what content your users are downloading or uploading.
The files that contain malware as reported by VirusTotal are flagged as high-priority events for your analysis. Usually, any of these events need to be taken very seriously and appropriate remediation should be done quickly.
Please enter your free VirusTotal key here if you have one. if you do not have one, we highly recommend registering with VirusTotal at the link provided and getting a free key. If you do not want enter a VirusTotal key, your malware detection will be limited.
If you do not want to log all file activity, uncheck 'Log All File Transfers'.
Passive ModSecurity
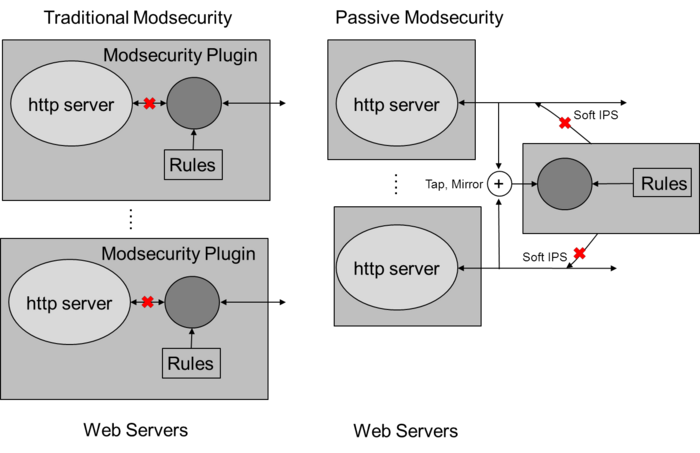
Enabling File Carving also enables, by default, Passive ModSecurity. Traditionally, ModSecurity is deployed as a web application firewall plugin directly on the web servers. It then uses a number of IDS ModSecurity rules to inspect the inbound requests to the web server and blocks unwanted malicious requests. MetaFlows has developed the capability of deploying ModSecurity inspection on the sensor. Whenever a web request is detected by the sensor, it is analyzed by the ModSecurity rules and corresponding alerts are generated as system daemon syslog events detailing the exploit.
ModSecurity Alerts
These alerts are generated any time an external IP address (which is not in the HOME_NET specification) or an internal IP address attacks one or more web servers. An example outbound ModSecurity event alert is shown below:
modsec_out/CRITICAL/960010 Request content type is not allowed by policy - pan.baidu.com/rest/2.0/dss/online -- application/x-www-form-urlencoded
In addition to the flow information (not shown for clarity), the alert message specifies:
- Whether it is an inbound (modsec_in) or outbound (modsec_out) attack (modsec_out in this case),
- The class of alert (CRITICAL in this case),
- The rule ID that triggered (960010 in this case),
- The description of the rule (Request content type is not allowed by policy in this case),
- The URL that caused the alert (pan.baidu.com/rest/2.0/dss/online in this case), and
- The mime type returned by the request (application/x-www-form-urlencoded in this case)
Client Mode or Server Mode
When ModSecurity is enabled, it can run in either Client Mode or Server Mode.
Client Mode should be selected if the user is monitoring a network predominantly to detect client based malware. In Client Mode, the MSS adds a behavioral detection layer to filter out false positives due to the fact that typically most client network trigger quite a few raw ModSecurity alerts. This is due to the high heterogeneity of external web servers accessed by client-based networks. In this mode, a ModSecurity alert is only recorded if the same IP address triggers multiple ModSecurity rules with multiple servers. Alerts are also recorded only if the servers respond with 4xx or 5xx errors indicating the HTTP requests were malformed or prohibited. Client mode, therefore, only triggers if the same source of ModSecurity exceptions is spread over time and multiple targets thus indicating a brute-force scanning behavior.
Server Mode should be selected if the user is monitoring a network predominantly to detect attacks to their web servers. In server mode, the MSS generates mdosec_in or modsec_out alerts for every ModSecurity rule that triggers. It is recommended that in this mode the user carefully monitor the ModSecurity alerts to eliminate false positives by disabling specific ModSecurity alerts that are not considered harmful (for example allowing POST methods or allowing request without the host parameter in the HTTP request). The tuning of ModSecurity alerts can be performed using the ModSecurity Rule editor.
ModSecurity Rule Editor
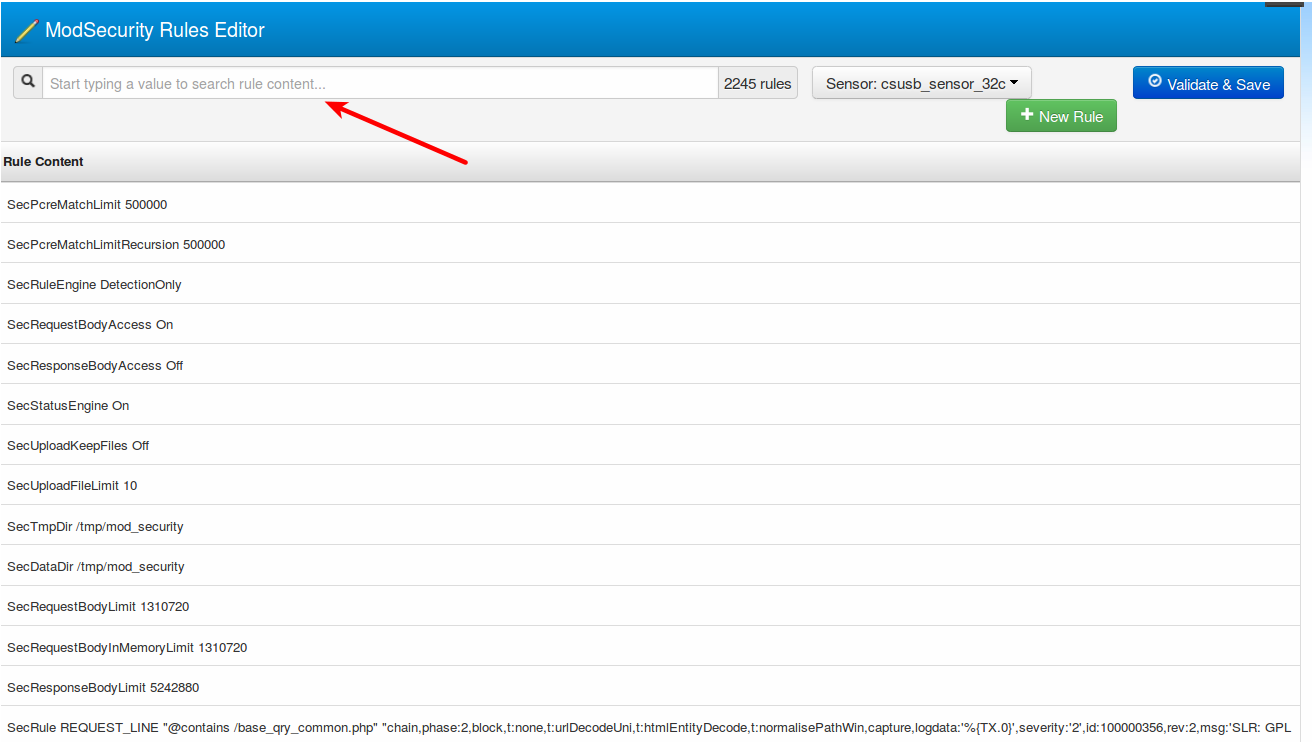
The ModSecurity Rule Editor allows the user to edit, or disable ModSecurity rules and configuration options. It is recommended that the initial configuration options not be modified. We recommend that the editor be used primarily to disable or enable particular rules. Note that any time a rule is disabled or edited, it will be remembered and any following rule updates from SpiderLabs will not overwrite the user changes. If you want to revert the rules to a default configuration where they are updated by SpiderLabs distribution, contact support@metaflows.com.
The ModSecurity Rule Editor can be accessed through the Rules Menu.
This will bring up a Sensor Selection Menu. Select a particular sensor to manage it, as shown in the picture.
There is a search capability to quickly find specific rule IDs of interest or any other specific text in the rules. Typing the search string will bring up the matching rules.
Once the appropriate rule or directive is found, hovering over it will show a disable/enable or edit menu. Disabling a rule or editing it will save a temporary copy of the rules.
Selecting Validate will run a test on the modified rules to make sure they will run on the sensor without causing any faults. Once validated, the user is prompted to restart the sensor in order to apply the change to the running system. This restart operation can be delayed or can also be executed by entering the following command on the sensor itself at any time. Until the sensor restarts, the old rules will still be in effect.
/nem/etc/mss.sh restart
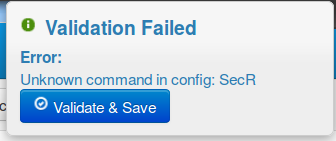
If the validation fails due to a syntax error, the system will provide some debugging information to the user and prompt the user to fix the issue before continuing.
Automatic Blocking for Priority Rules
You can enable a default block level for rules that are listed on the MetaFlows Session Serial Number (SID) priority map. These rules are collected and ranked each day using data from every domain currently being monitored by a MetaFlows sensor.
You can view the raw data for the rules at https://nsm.metaflows.com/sid_priority.map .
Once a new default block level is chosen and the sensor is saved, you will be prompted to reload and save the rules in order to apply the changes.
<figure id="fig:sensor_autoblock">
</figure>
Manage Local Rule Source
Some users choose to manage their IDS rules locally and manually update them rather than using our automated IDS update process Users choosing to manage rule sets locally can do so by entering the directory for the local rule set files here. If you want to manage your IDS rules completely independently from our system, check this box and store all of your rules in /nsm/localrules/ on the sensor. You will be responsible for updating and maintaining your rule set in that directory. Note that if you manage your rules locally, the rule management interface will be disabled and you will not get any rule updates from us.
| Previous Chapter | Next Chapter |
 1 (877) 664-7774 - support@metaflows.com
