Dashboard
From The MetaFlows Security System Documentation
Dashboard Overview
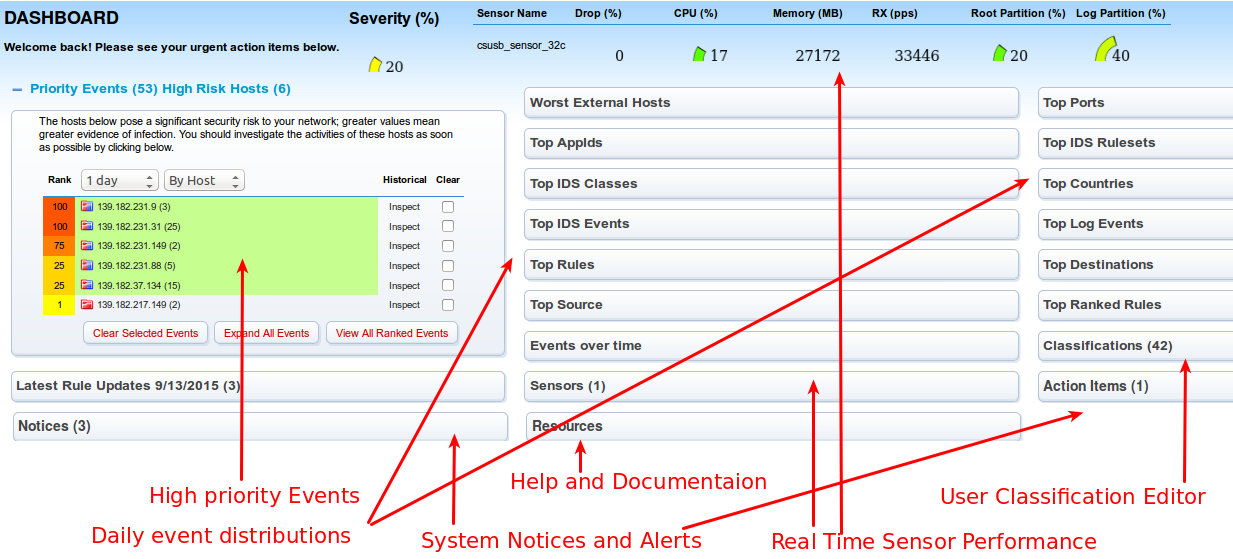
The Dashboard is the first page that loads when logging in and provides:
- An overview of the current high priority events for the last day, week, or month,
- Top level event distribution volumes for the last day,
- Real-time sensor performance information,
- An editor for the user-defined classifications, and
- Some system level notices and help resources.
Selecting the titles collapses or expands the individual sections. Some sections are opened by default because they usually provide the most relevant information regarding the security of the monitored network.
High Priority Events
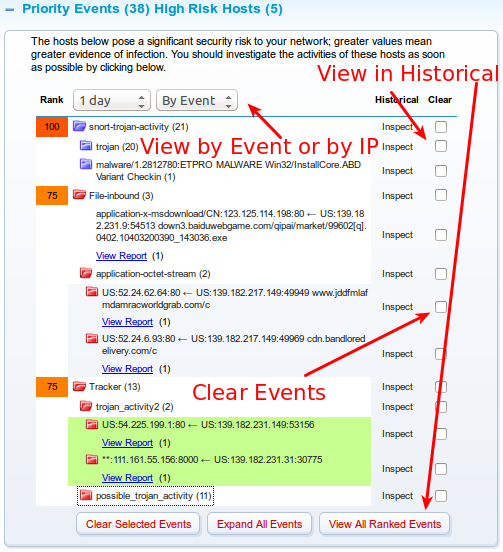
This is the most important part of the Dashboard; it provides information on what the MSS perceives the most dangerous incidents.

This information can be displayed by aggregating the events IP address or by event types. In addition, from this interface the user can:
- Clear all events associated with a particular incident if perceived to be irrelevant or if remediated. Cleared events will not appear unless the user specifically queries for them through the search interfaces,
- Directly inspect the incident reports, and
- Inspect the events constituting an incident through the Historical Interface.
| Previous Chapter | Next Chapter |
 1 (877) 664-7774 - support@metaflows.com
